Lumascopes
Applications: Widefield Fluorescent Imaging
Images were taken using the Etaluma microscope every 5 minutes for 6 days with media changes performed every other day.
Widefield Fluorescent Imaging for Cell Morphology Study
Understanding how cells change shape in response to their environment is central to unlocking the complexities of gene expression, tissue organization, and disease progression. In a recent study titled “Regulation of chromatin modifications through coordination of nucleus size and epithelial cell morphology heterogeneity,” Alexandra Bermudez and the Neil Lin lab at UCLA revealed a remarkable link between cell crowding, nuclear size, and epigenetic changes.
To capture this dynamic interplay, the researchers relied on widefield fluorescent imaging to monitor cellular and nuclear changes over time. Using a 20×/0.40 NA objective with an Etaluma microscope, the team performed high-resolution time-lapse imaging every five minutes for six consecutive days—an impressive feat that underscores the system’s ability to support long-term live-cell studies through the use of low powered LED’s that won’t damage the cells.
Widefield fluorescence provided the spatial clarity and sensitivity necessary to visualize chromatin states and track morphological heterogeneity across densely packed epithelial cells. By combining this imaging technique with automated media changes and consistent illumination, the researchers could maintain optimal culture conditions while collecting thousands of high-quality images for analysis.
Etaluma’s fluorescence microscopes are uniquely suited for these applications—compact enough to operate inside an incubator, yet powerful enough to reveal fine cellular details in real time. The integration of widefield fluorescent imaging into this study played a crucial role in documenting how mechanical and spatial constraints within a tissue environment influence nuclear architecture and, ultimately, gene regulation.
You can read the full research article here.

A Image of MDCK cells stained with Histone H3 Lysine 27 trimethylation (H3K27me3) illustrating its variable expression levels in different cells. Scale bar = 50 μm. B Correlation between normalized H3K27me3 expression level and nucleus area in MDCK cells. N = 461. 95% confidence interval is [−0.447, −0.194]. C Image of an E12.5 mouse epithelium stained with H3K27me3. Scale bar = 25 μm. D Correlation between normalized H3K27me3 expression and nucleus area in the mouse epithelium. N = 130. 95% confidence interval is [−0.459, −0.209]. E Image of MDCK cells stained with Histone H3 Lysine 9 acetylation (H3K9ac). Scale bar = 50 μm. F Correlation between normalized H3K9ac expression and nucleus area in MDCK cells. N = 1130. 95% confidence interval is [0.183, 0.293]. G Image of an E12.5 mouse epithelium stained with H3K9ac. Scale bar = 25 μm. H Correlation between normalized H3K9ac expression and nucleus area in the mouse epithelium. N = 713. 95% confidence interval is [0.0988, 0.241].
See Other Use Cases and Features of our Lumascopes
Live cell imaging
See Etaluma – Cardiac Myocytes Undergoing Division
Cell growth and confluence
See Time Lapse Video of MSC in 2D Cell Culture
Cell migration and wound healing
See Cell Migration & Wound Healing Application Note
See Migration of MSC in 2D Cell Culture
Cell cycle protein expression
See Human HT1080 Fibrosarcoma Cells with LS600
Use of micro-environmental systems
See Bioptechs products on Etaluma LS500
Calcium assays
GCAMP5 activity in a sensory neuron
Determining transfection efficiency
In Vitro Exercise Model
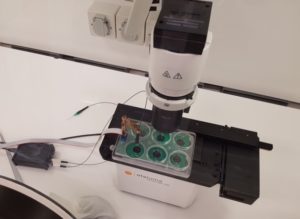 Cultured skeletal muscle myotubes are electrically stimulated under hypoxic conditions and with temperature manipulations. Cell signal transduction dynamics are measured using proteomic techniques to help understand how exercise stressors are translated into fitness-promoting adaptions such as increased mitochondria. Probe in photo measures PO2 in the cell medium rather than in the atmosphere. LS620 allows visualization of contracting cells and assessment of their health.
Thank you to Dr David Clarke and his lab, Laboratory for Quantitive Exercise Biology, Simon Fraser University, British Columbia, Canada
Behavior of stem cells
See Etaluma-Human Neural Stem Cells in Culture 1
See Etaluma-Human Neural Stem Cells in Culture 2
Also see reattachment of neuronal stem cells passaged with Accutase (scroll down to see video)
Cell death assays
Apoptosis induction
Spheroid development and behavior
See 3D Spheroid Formation of MSC
See Spheroid-Migration of MSC in a PEG-Fibrinogen Hydrogel
Cultivation of yeast
See Cultivation of S. cerevisiae in Core-Shell Microcapsules
Intravital studies
See Series: Neutrophil migration intravital mouse imaging
Study of lower eukaryotes
Photomicroscopy in locations without AC power
Copyright © Etaluma, Inc. All rights reserved.